Top Violated Ordinances
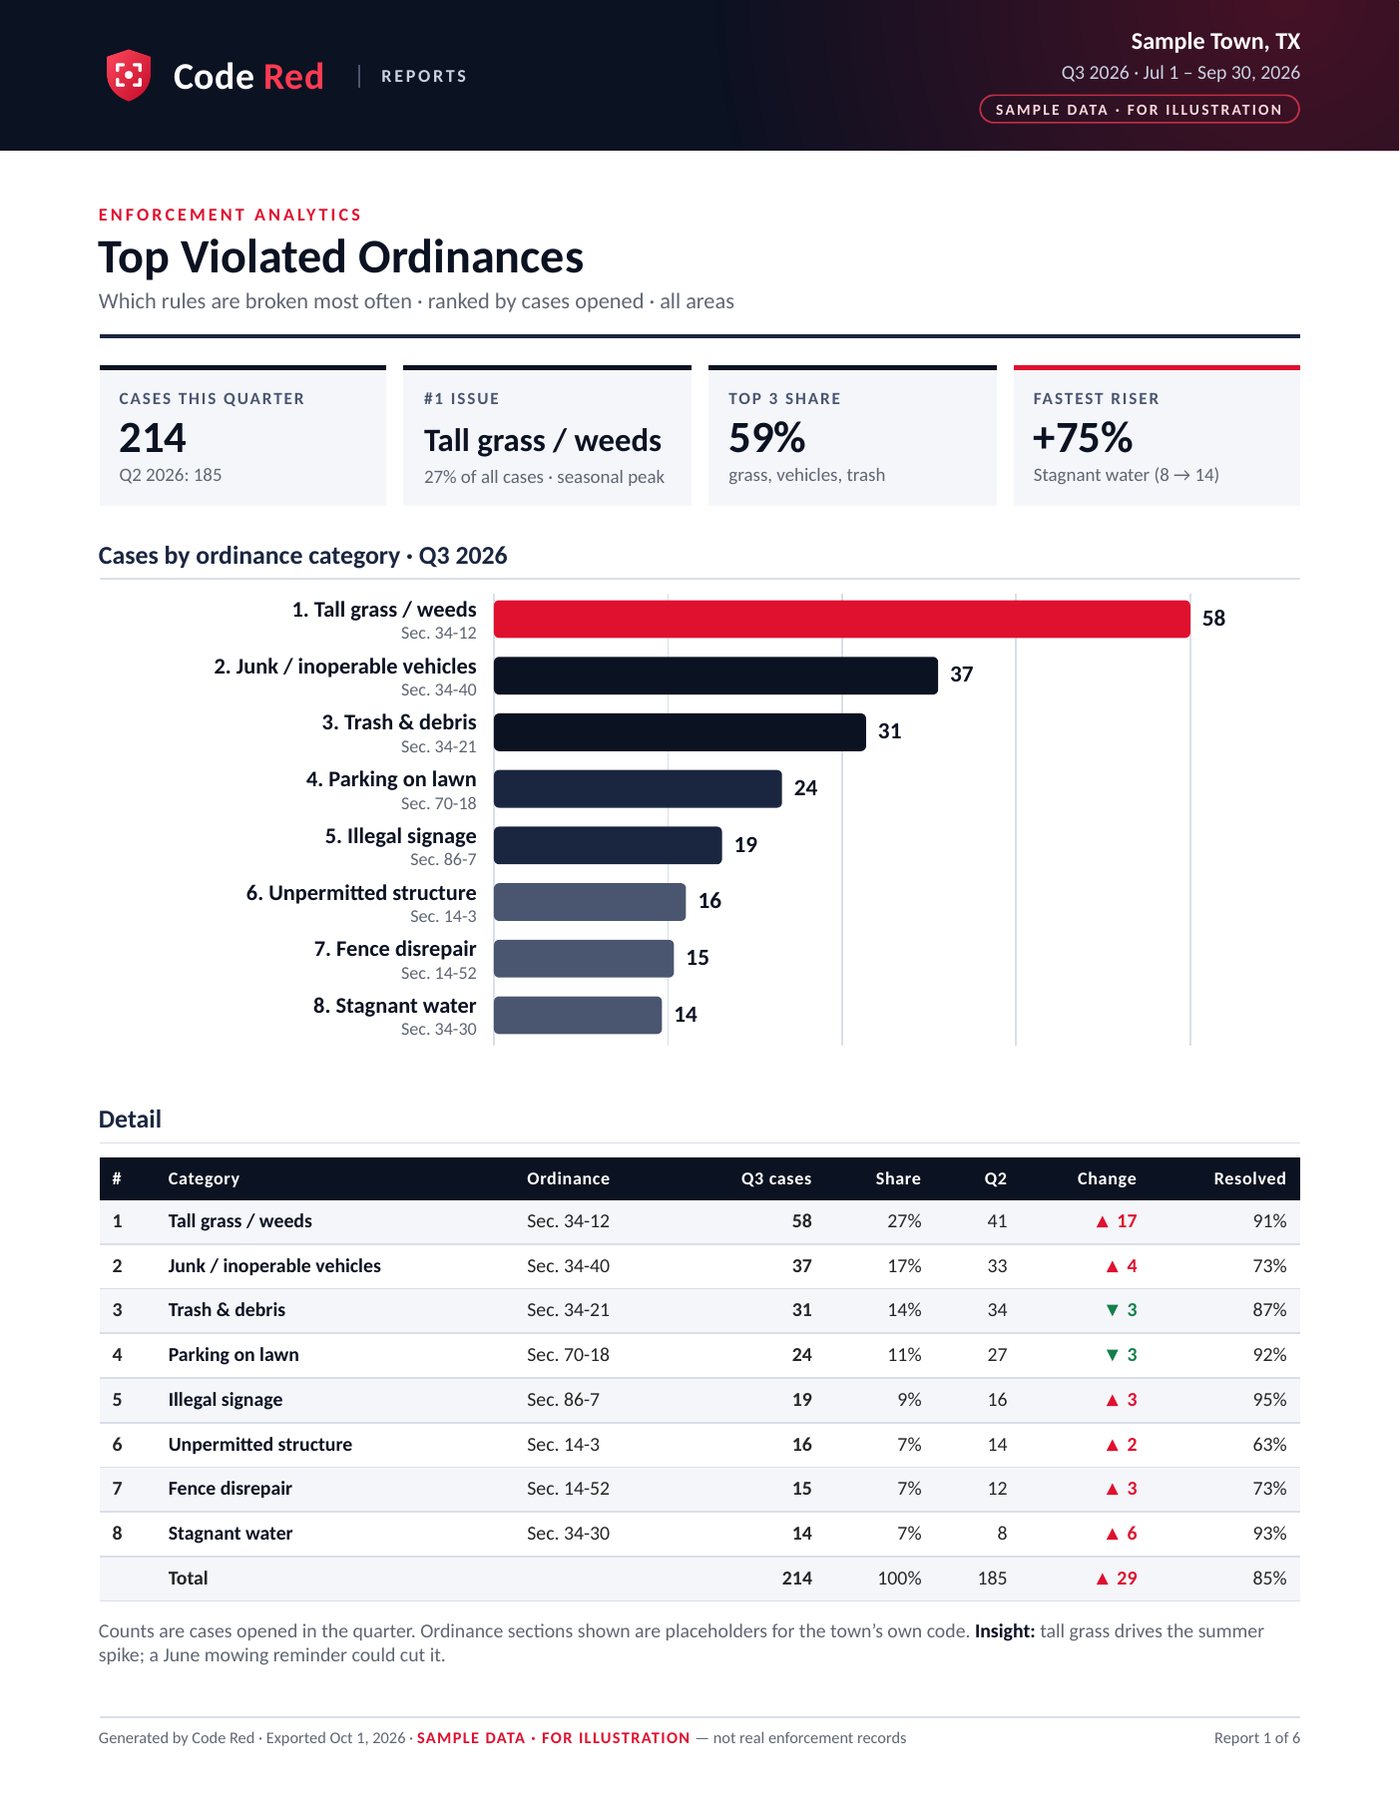
Which rules are broken most often, ranked by cases opened, with the ordinance section, change from last quarter and resolution rate.
Open full sizeEvery notice Code Red drafts is logged, so daily, weekly and monthly reports come straight from the record: which areas need attention, which issues keep repeating, and what’s improving.
Cases by area and the hot spots to focus on.

Same property, same issue, flagged over time.

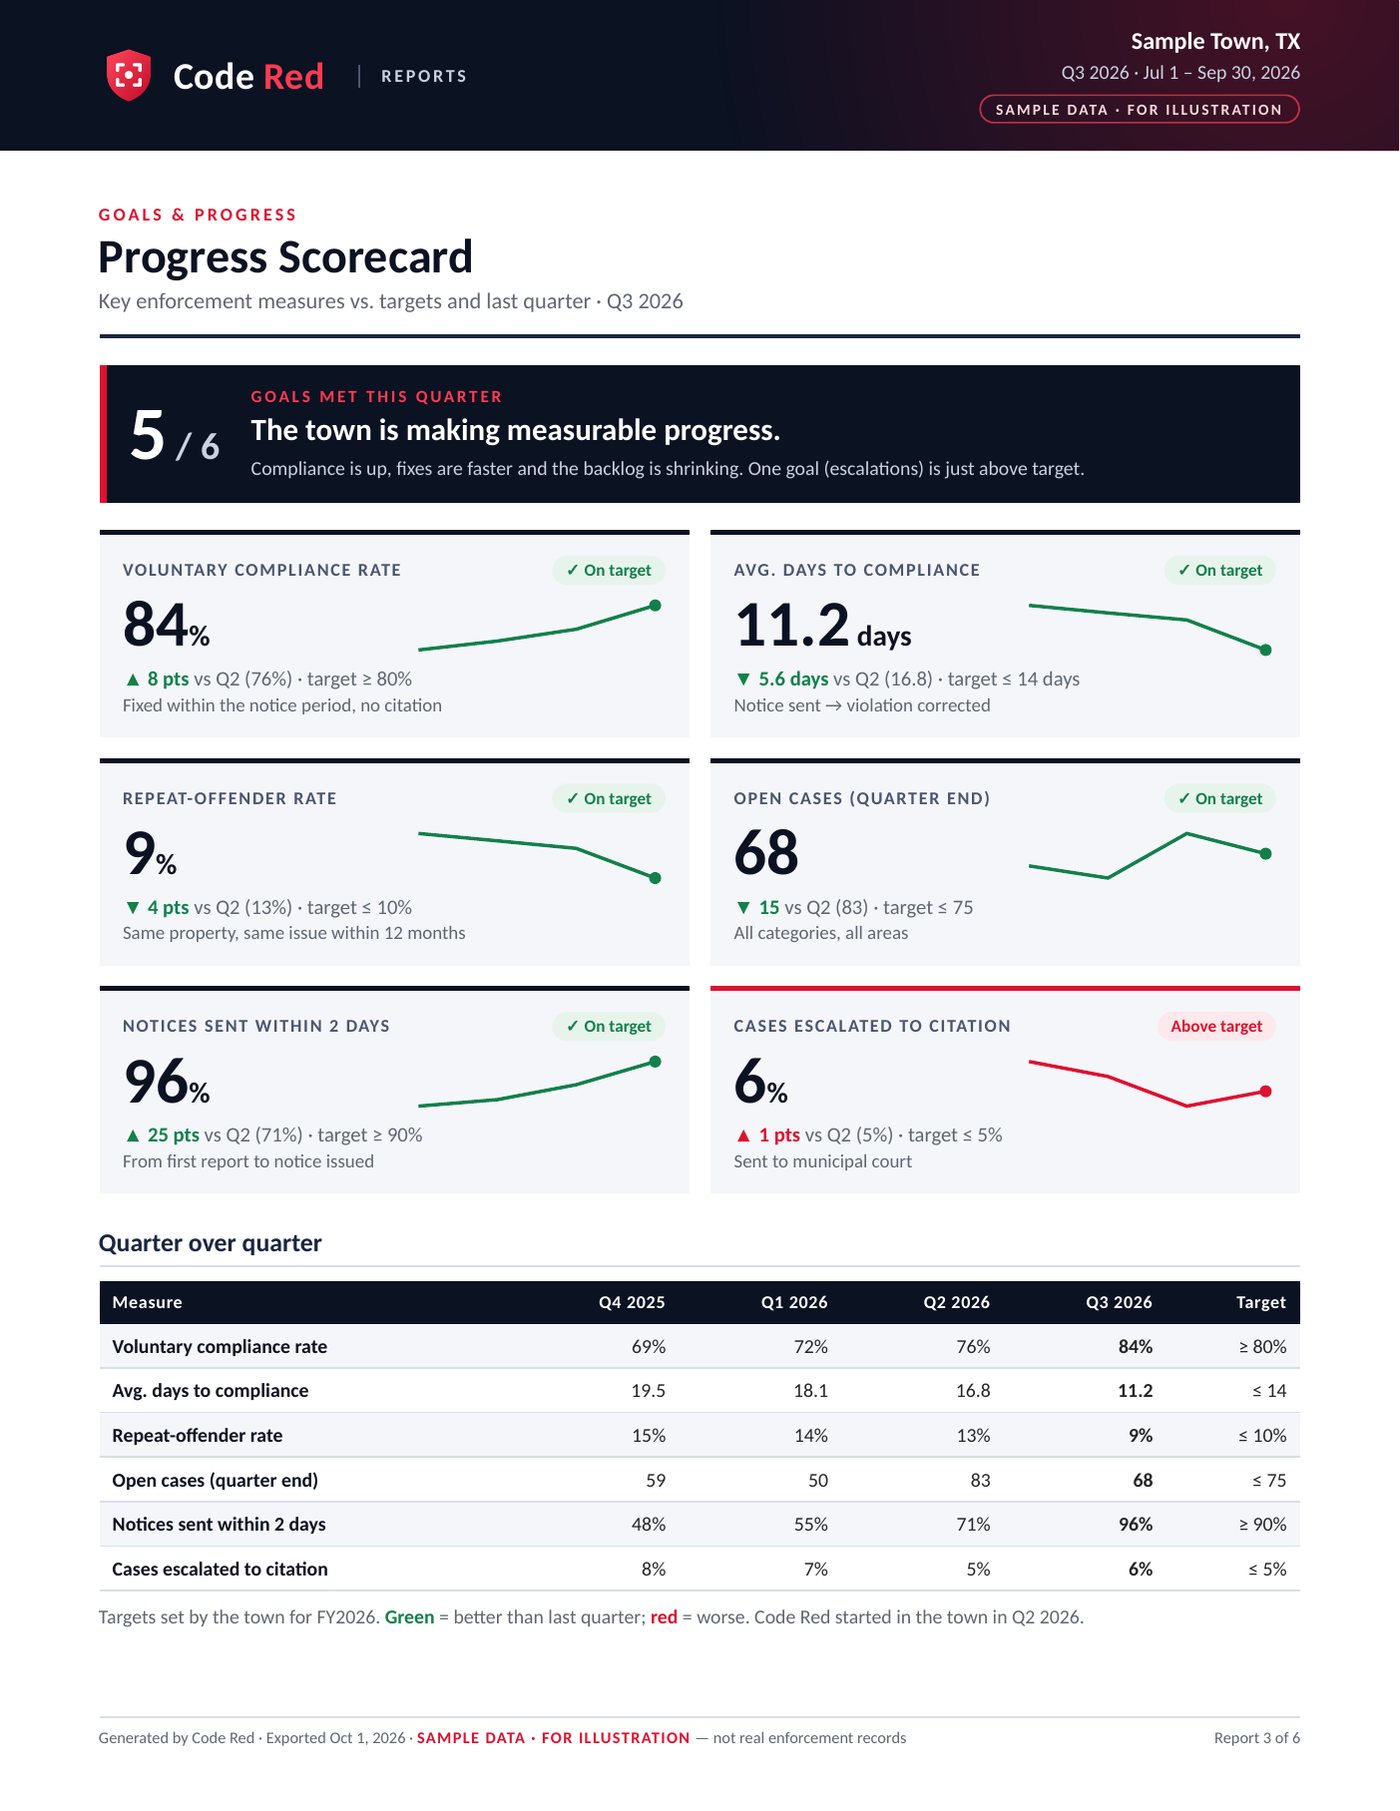
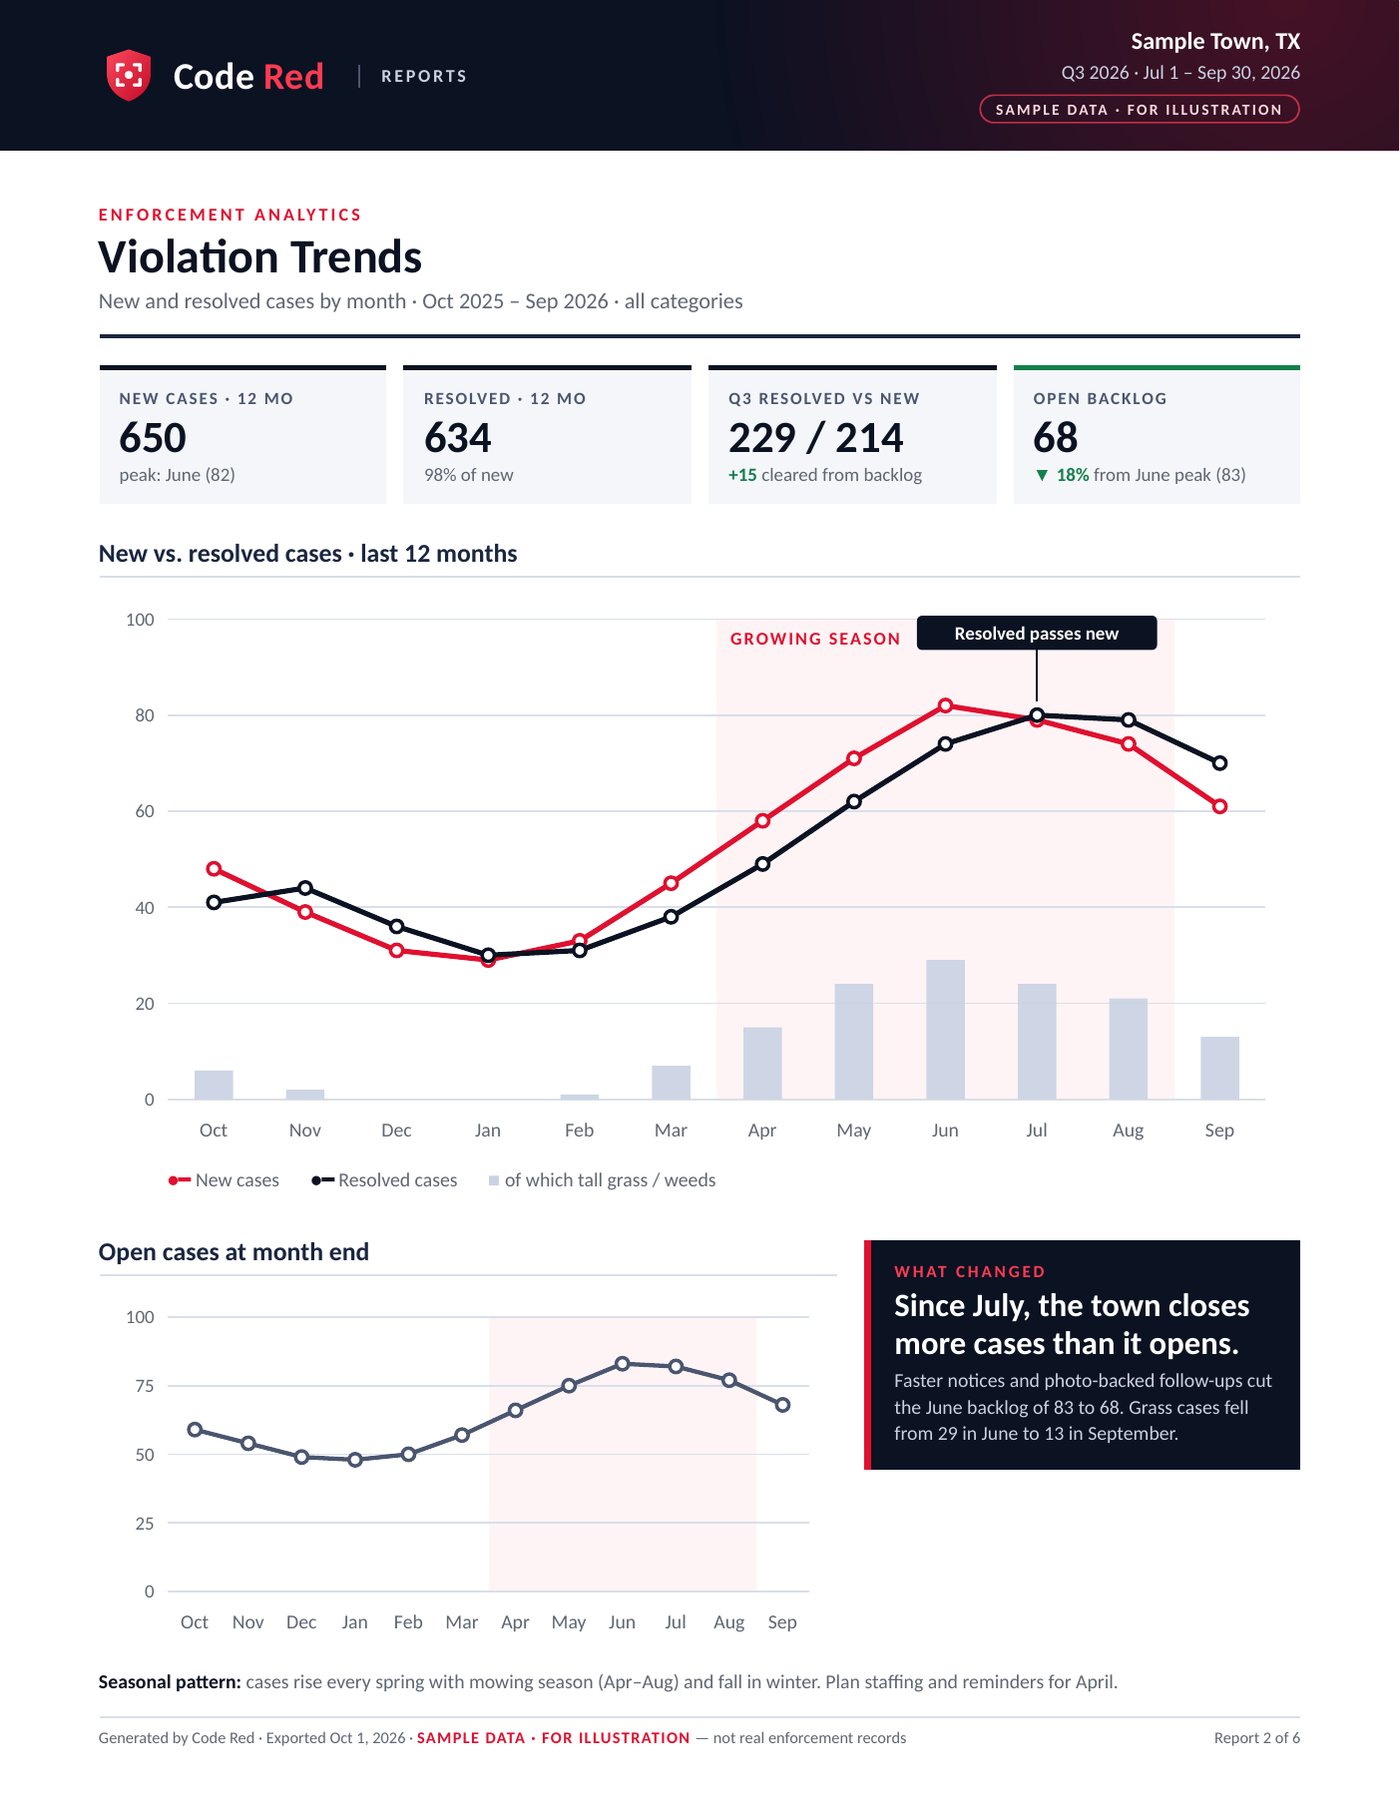
Trends and progress against your own goals.

On your schedule, ready for council and residents.
Click any report to open it full size. All reports shown use sample data for illustration, not real enforcement records.
Which rules are broken most often, ranked by cases opened, with the ordinance section, change from last quarter and resolution rate.
Open full sizeNew vs. resolved cases by month over 12 months, the open backlog at month end, and seasonal patterns to plan staffing around.
Open full sizeKey measures against the town’s own targets: voluntary compliance, days to compliance, repeat-property rate, open cases and escalations.
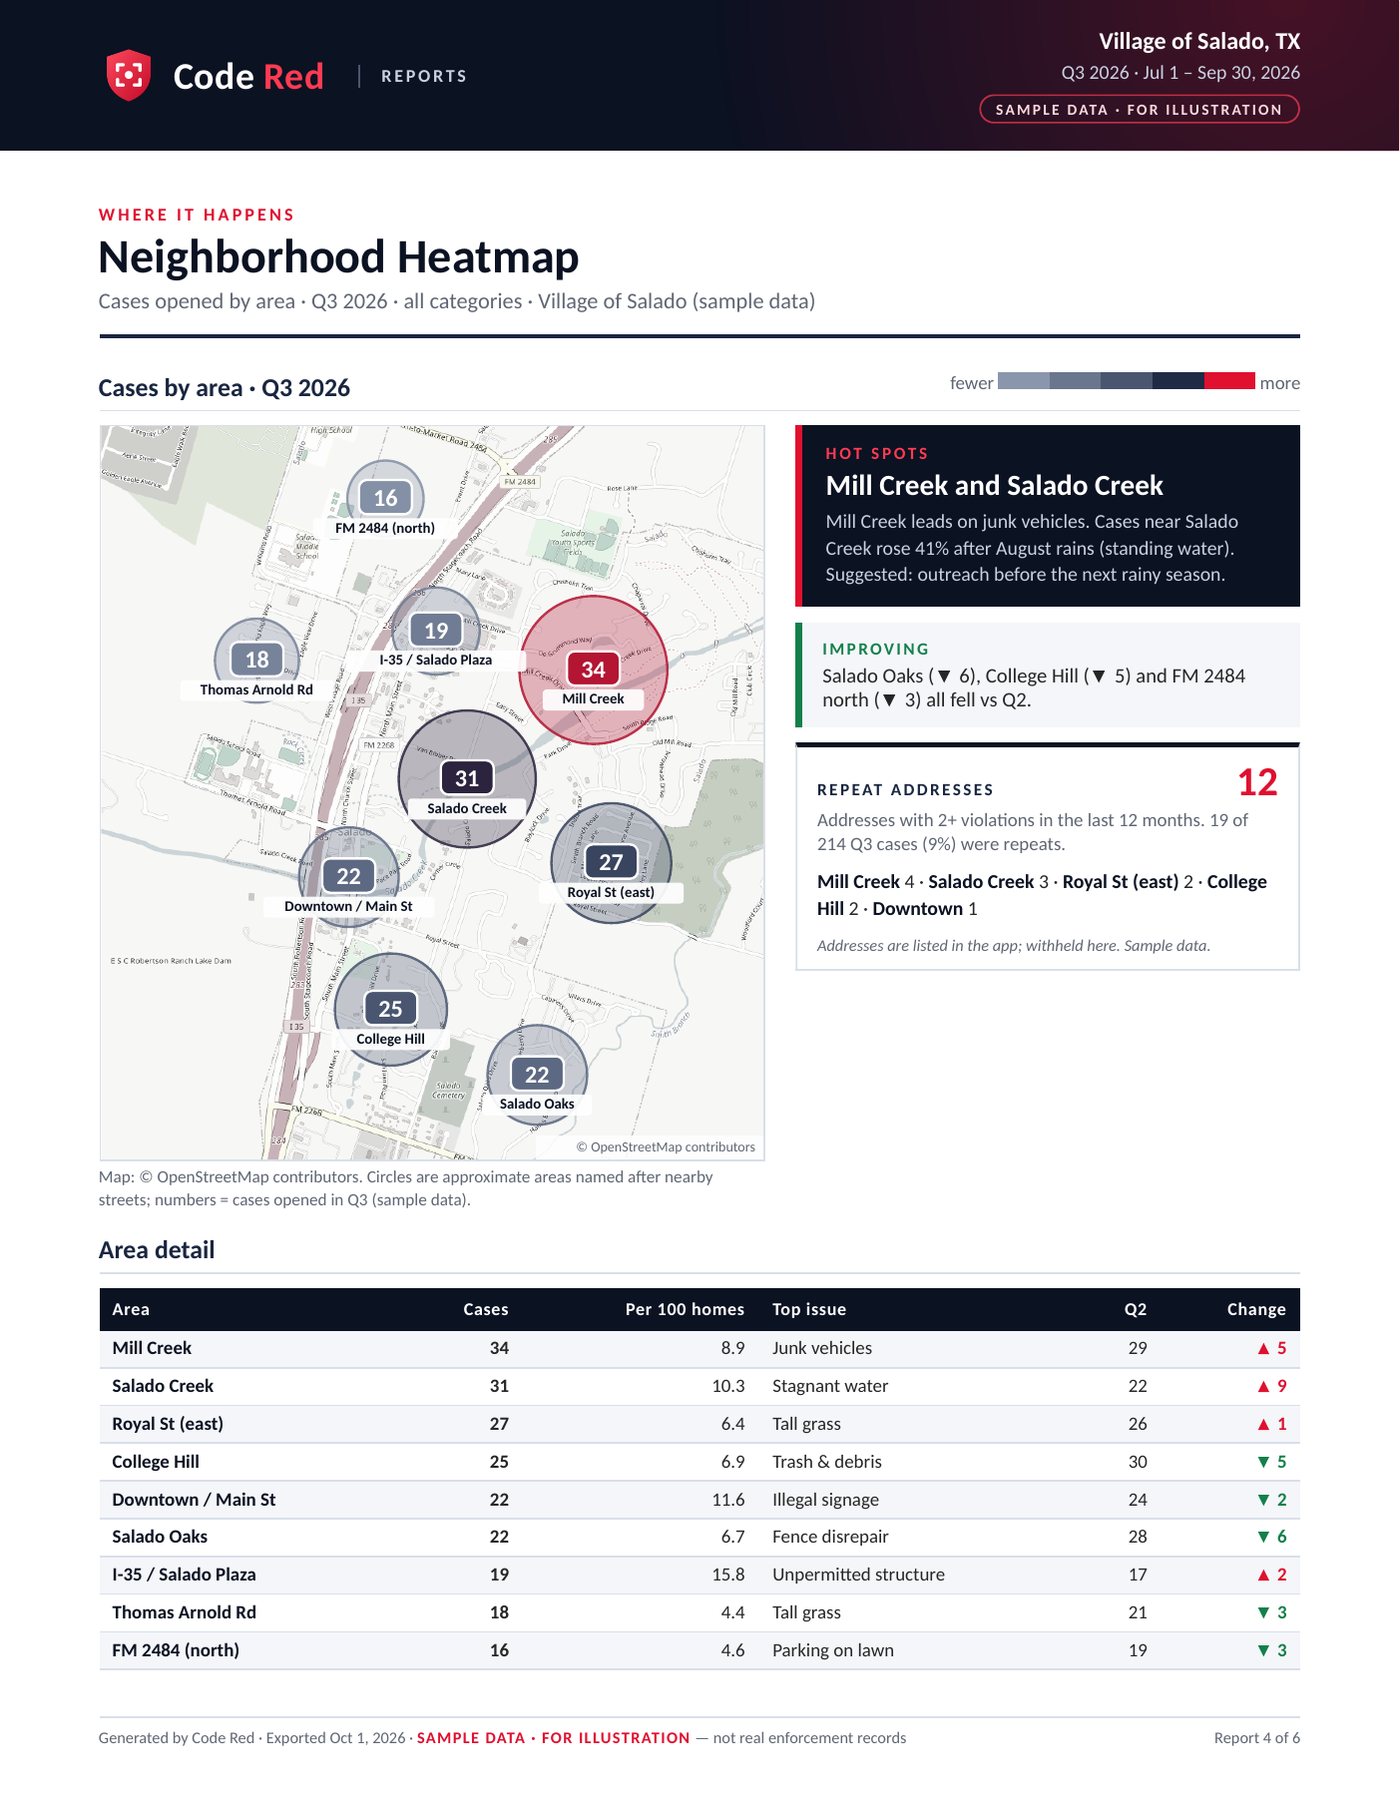
Open full sizeCases by area on a map, hot spots and improving areas, plus a count of repeat addresses (addresses withheld).
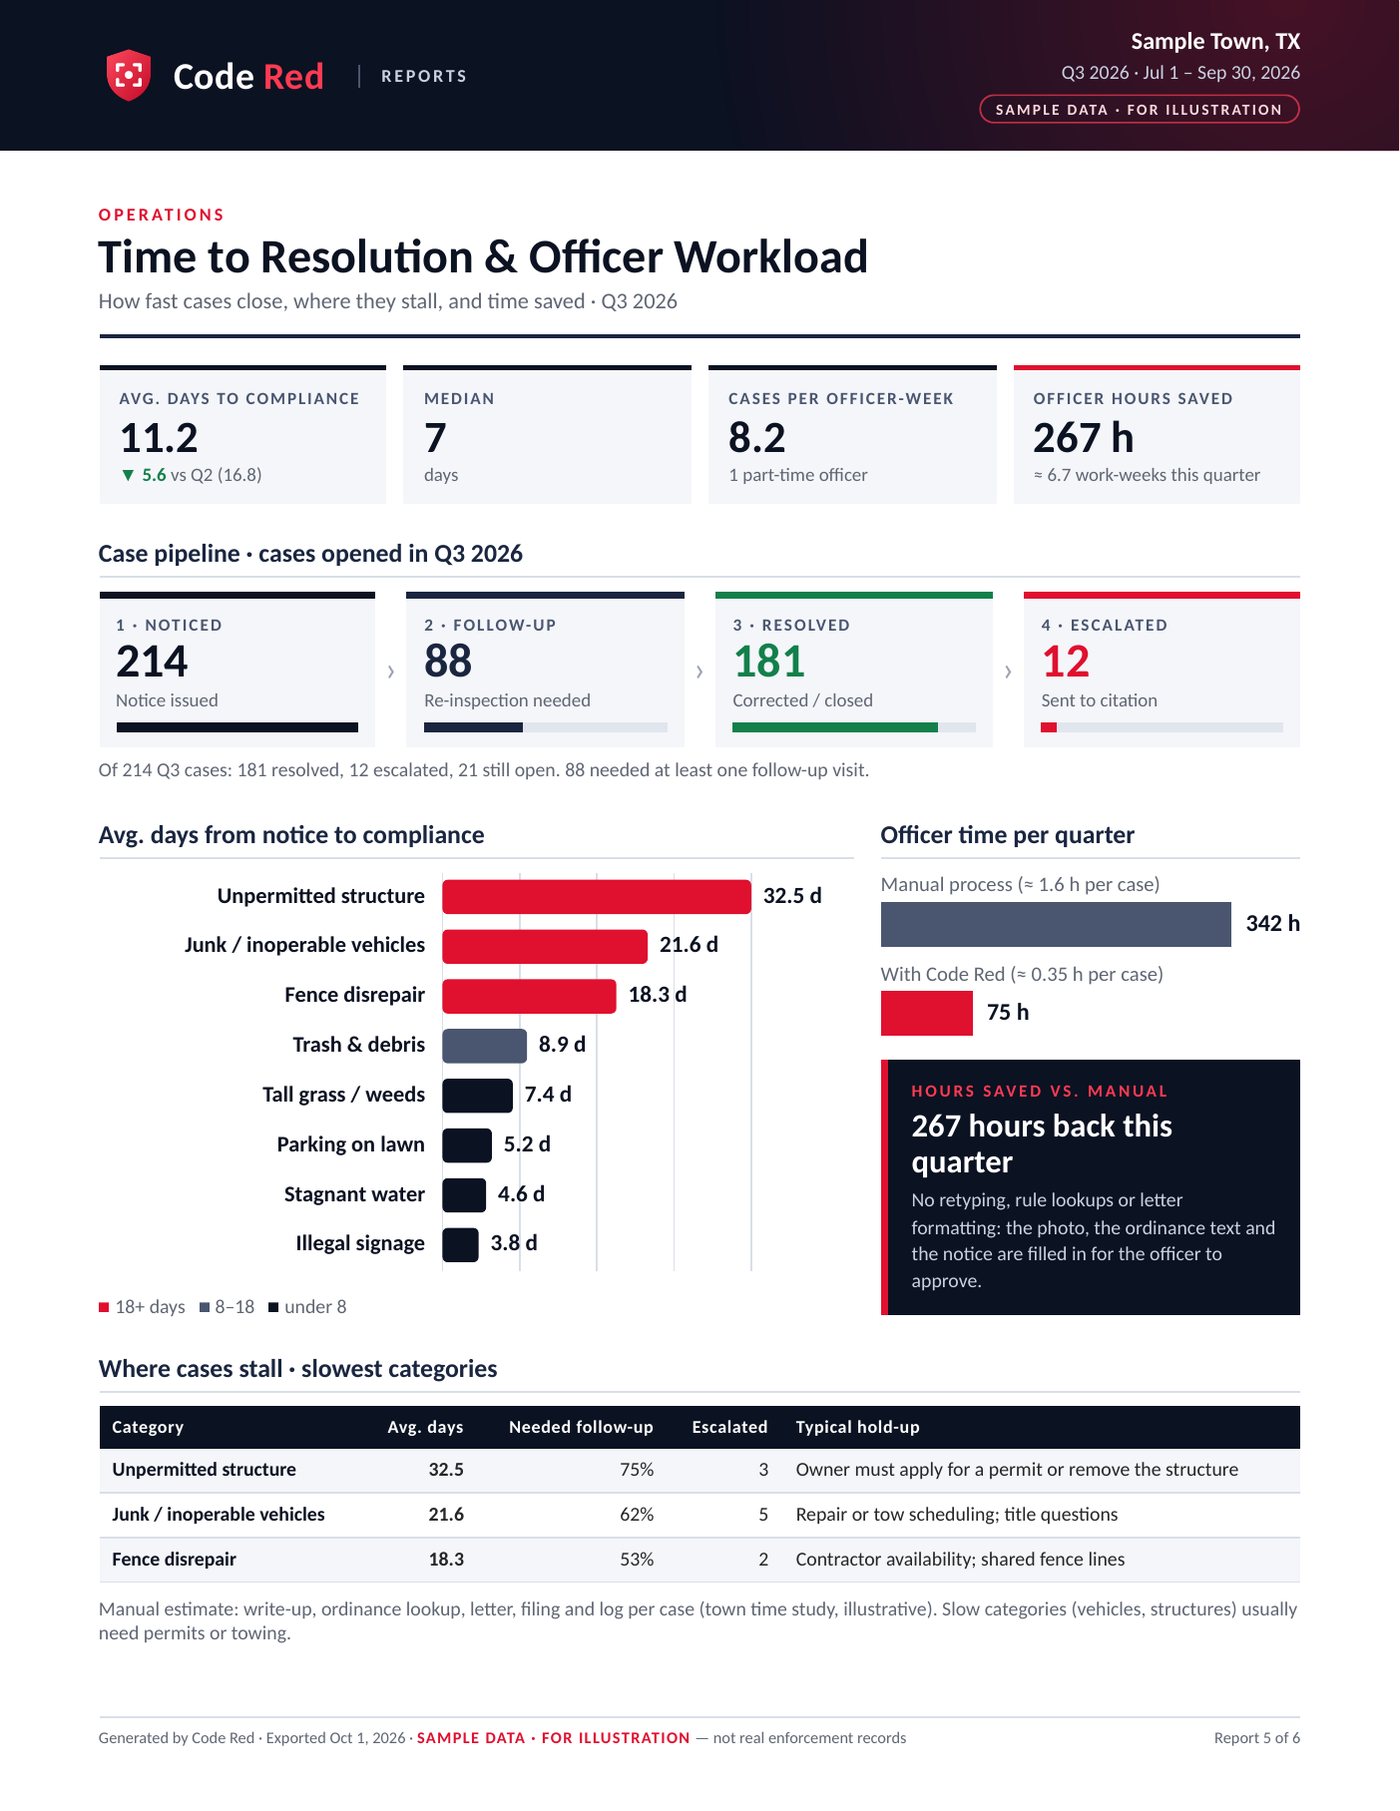
Open full sizeHow fast cases close, where they stall, the case pipeline from notice to resolution, and officer hours saved vs. a manual process.
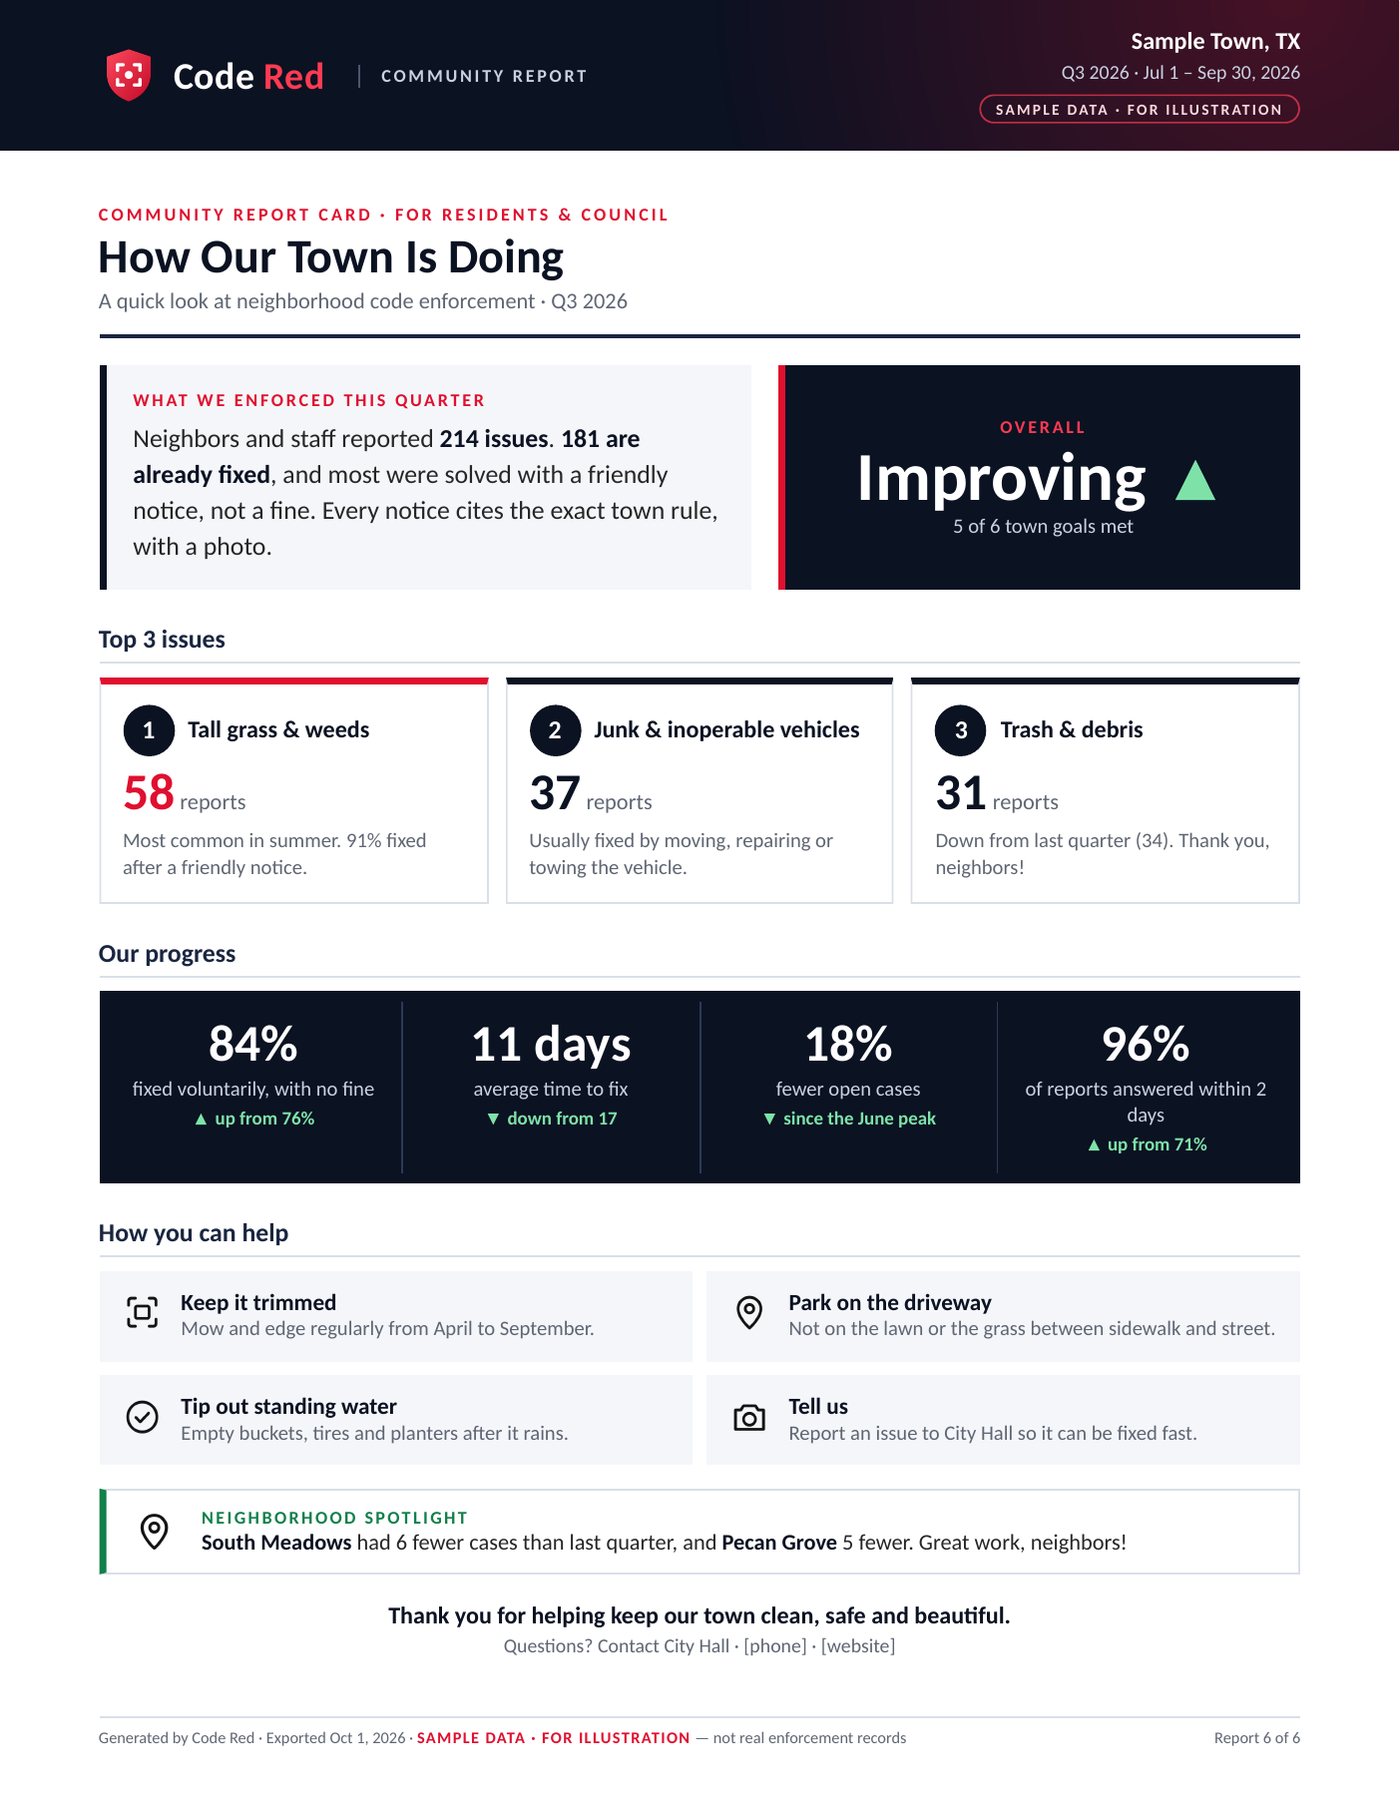
Open full sizeA plain-language summary for residents and council: top issues, progress on goals, and how neighbors can help.
Open full size
Reports come from the same record as your notices. Every photo, AI suggestion, edit and approval is logged in a tamper-evident audit trail. Code Red exports PDF reports, and case data as CSV or JSON.
Neighborhood Heatmap map data © OpenStreetMap contributors. Area names are used for illustration with sample numbers; addresses are withheld.
We’ll walk you through Code Red with your own ordinances. Pricing scales with your city’s size; ask about our founding-village pilot.